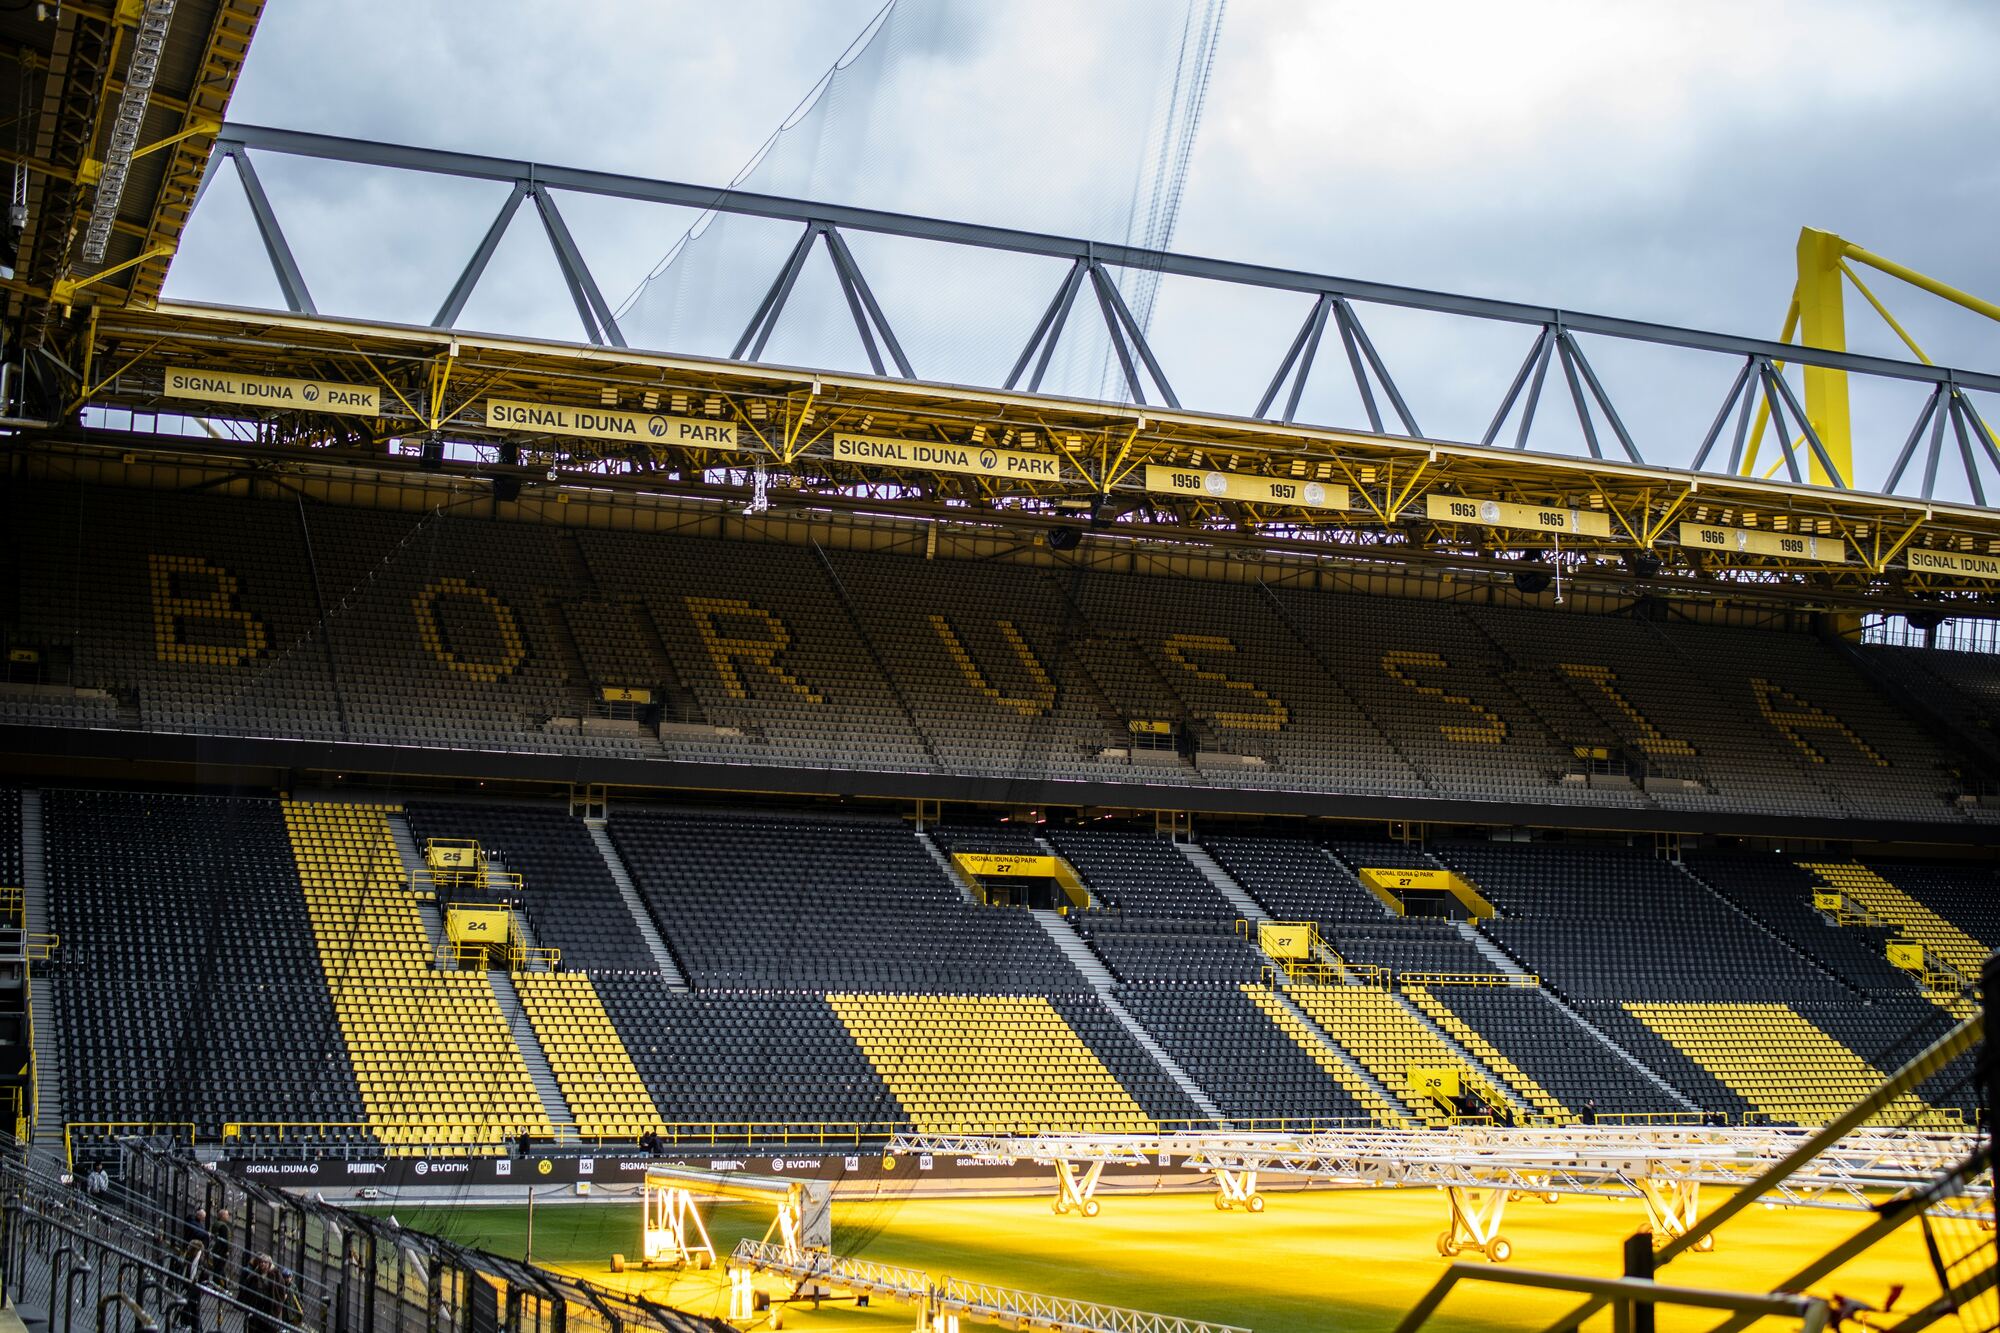
Signal Iduna Park, Dortmund. Photo: Chris Hahn on Unsplash
Ghost games
For ten years, away teams in Europe’s top leagues were shown more yellow cards than home teams. Then Covid emptied the stadiums, and the gap disappeared. A classic experiment on conformity helps explain why.
Dortmund, 16 May 2020. The Revierderby against Schalke is one of the loudest fixtures in German football. Dortmund’s south stand, the Yellow Wall, holds almost 25,000 standing fans, and on derby day it shakes.
That afternoon it was empty.
The Bundesliga was the first big league to come back after lockdown, and Dortmund against Schalke was its headline match. You could hear the players shouting to each other. You could hear the ball. Dortmund won 4-0, and at the final whistle the team walked over to applaud a stand with nobody on it.
Something else was different too, though nobody could see it on the day. Normally home advantage is a thing in football, but in the first 82 Bundesliga games behind closed doors, home teams won 32% and away teams won 45%. The advantage had flipped.
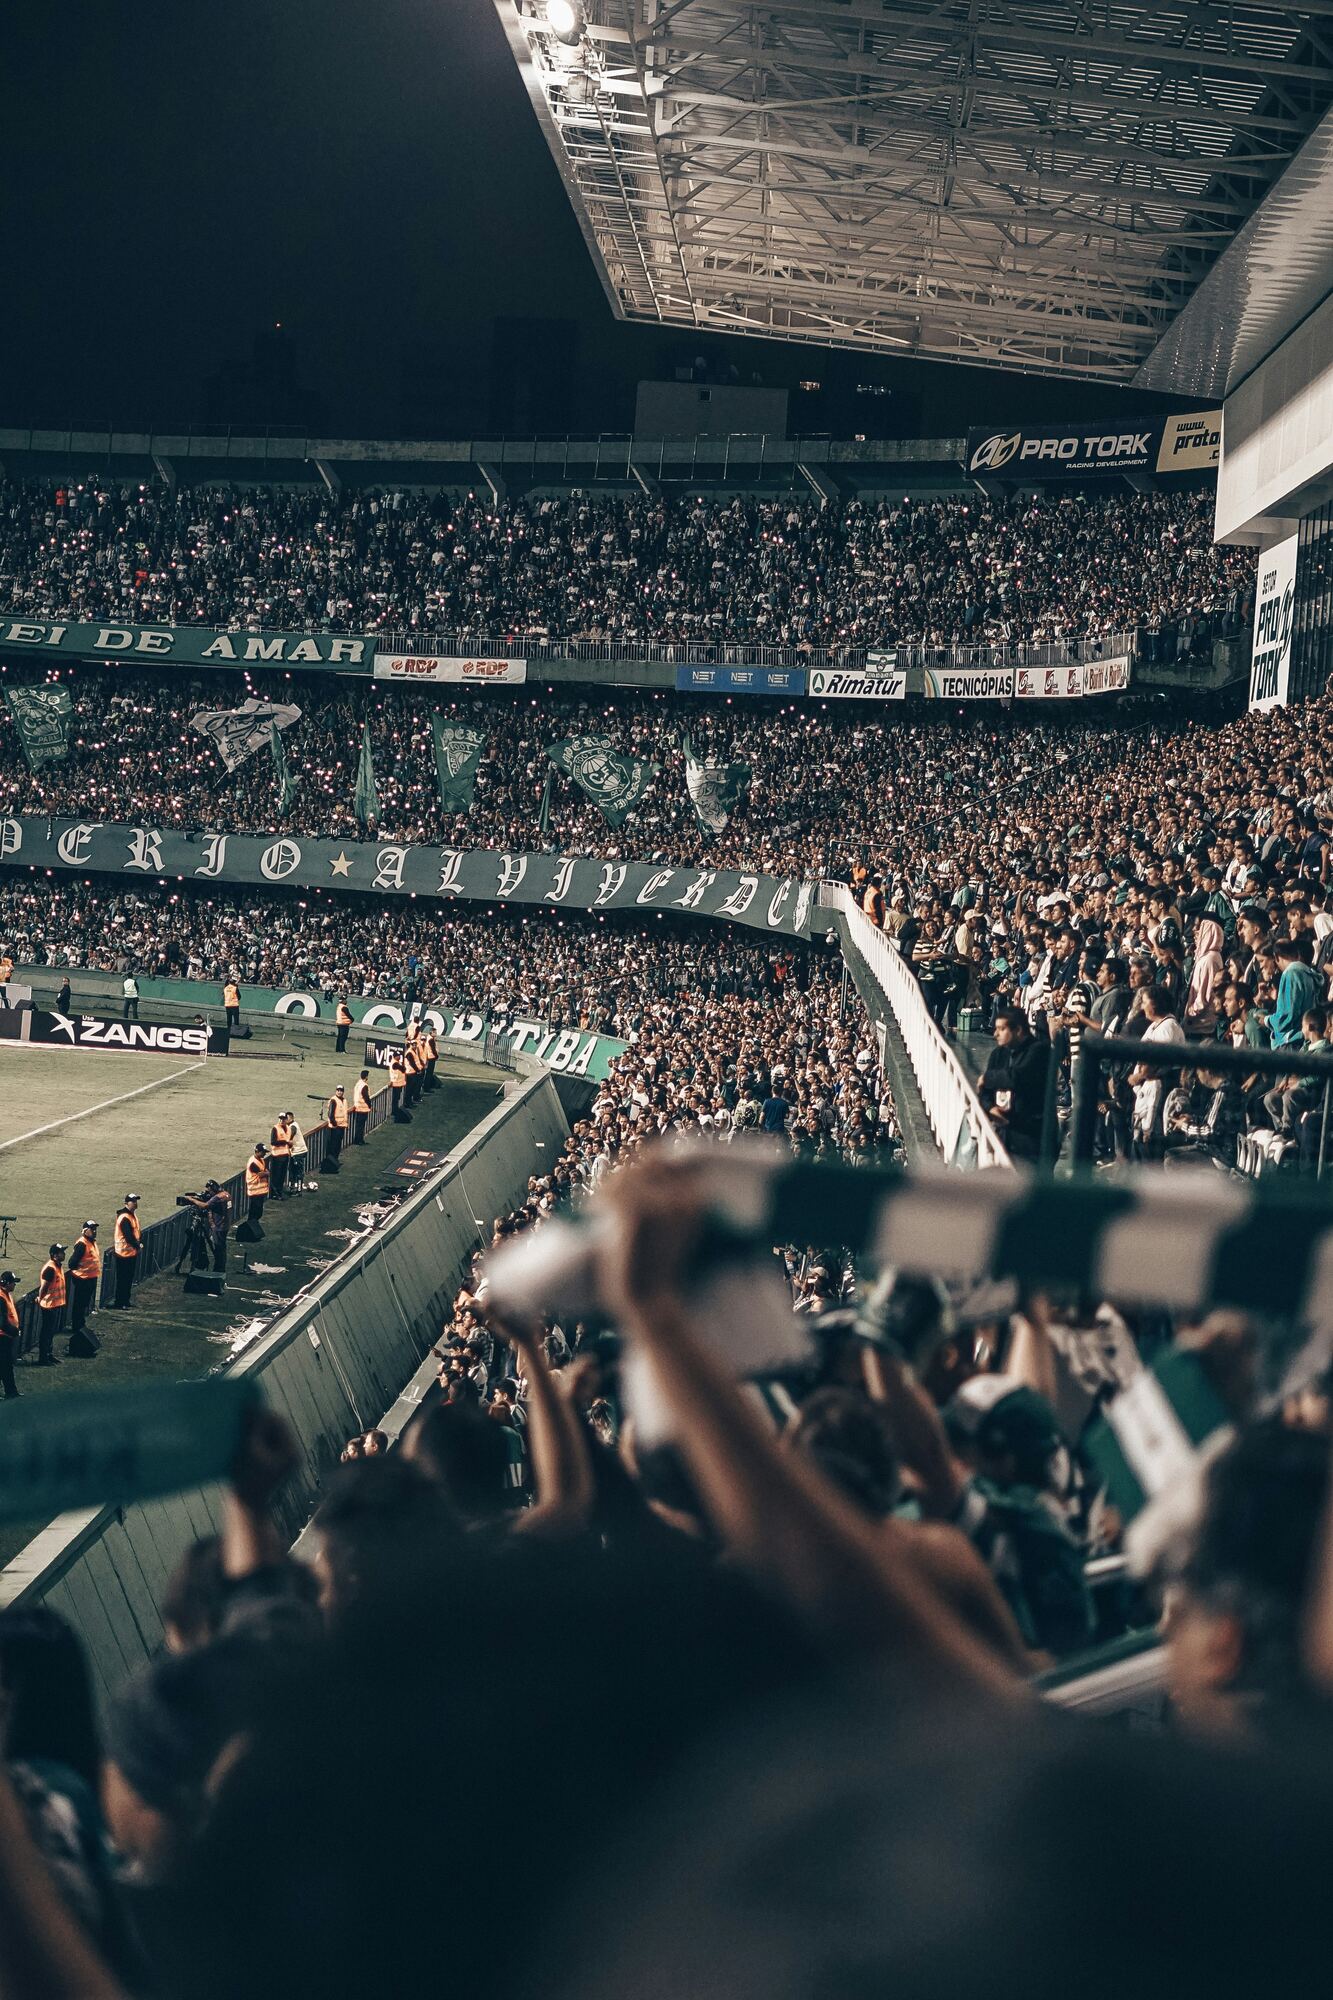
A home crowd in Curitiba, Brazil. Photo: Emerson Vieira on Unsplash
One against many
Home advantage is one of the oldest facts in sport. Fans blame travel, tiredness and strange pitches. But one person on the pitch hears the crowd more than anyone: the referee.
In 1951 the psychologist Solomon Asch sat a student at a table with seven others and showed them all a line. They were asked to compare the length of that line to three others and identify its match. The answer was very clear, there was a very obvious match. The trick was that the other seven participants were actors, and on 12 of the 18 trials they all gave the same wrong answer, out loud, before the real participant spoke. This had an enormous influence on the answers the real participant gave with about a third going along with the group.
Asch then made the task harder by making the lines closer in length, and conformity went up. When we aren’t sure, the crowd decides for us.
In our experiment the referee is the participant at that table, with 50,000 people giving the answer at once.
Psychologists suggest two reasons people gave in, named by Deutsch and Gerard in 1955. Some want to fit in and avoid the discomfort of standing out (normative influence). Others start to believe the group must be right (informational influence). A referee could be doing either.
The real-world test. In 2002, Alan Nevill and colleagues showed 40 qualified referees 47 tackles from a 1998-99 Premier League match, Liverpool against Leicester. Half watched with the crowd noise on, half with it off. With the noise on, they gave 15.5% fewer fouls against the home team, and were much less sure of their calls.
Photo: Reed Mok on Unsplash
The experiment nobody would allow
No league would ever let scientists empty its stadiums for a season to see what happens. Covid did it anyway, in every major league at once.
We looked at 27,141 matches in the Premier League, La Liga, Serie A, the Bundesliga and Ligue 1, from 2010-11 to 2024-25. That includes 2,234 games played without fans between May 2020 and June 2021.
From 2010 to March 2020, away teams were shown 2.16 yellow cards a game and home teams 1.88. In every one of those ten seasons, away teams got about a quarter of a card or more extra per game.

In empty stadiums, away teams got 1.95 yellows a game and home teams 1.93. The gap was gone. In the first weeks back, in the summer of 2020, home teams were actually shown more yellows than away teams.
It wasn’t one league. In all five, the gap fell to almost nothing.

Results shifted too. With fans, home teams won 46% of games and away teams 29%. Behind closed doors it was 40% and 35%.

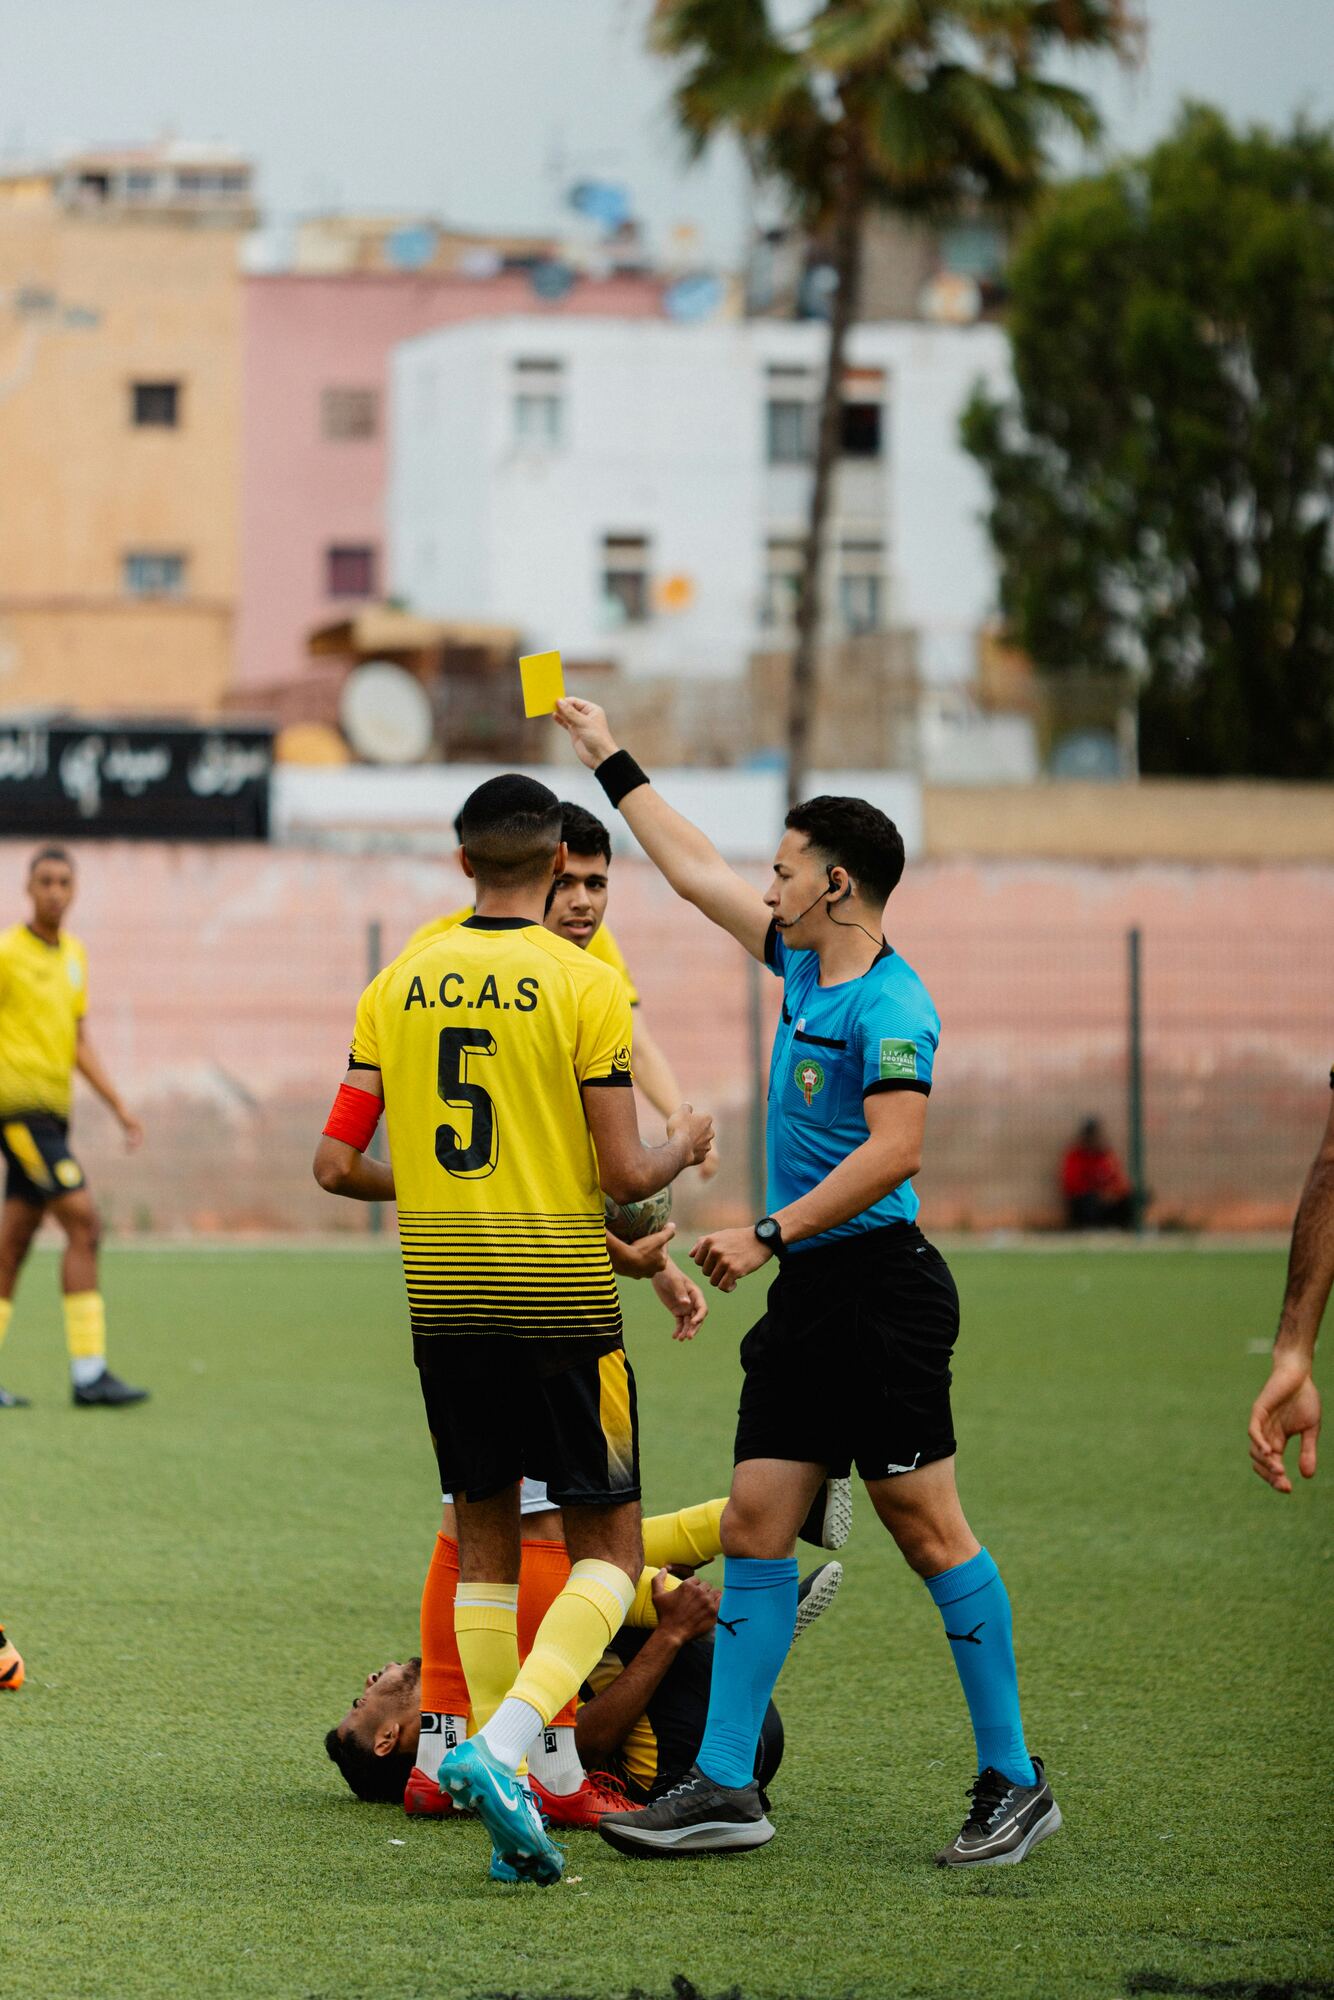
Photo: Salah Regouane on Unsplash
Close calls
Asch’s harder lines suggest a test. If the crowd works on the referee through conformity, it should matter most where the referee has to make a judgement call.
A yellow card is a judgement. A shot on target isn’t: the ball either goes towards goal or it doesn’t.
With the fans making the atmosphere, away teams got 15% more yellow cards than home teams. In empty stadiums the difference was 1%. The referees’ home bias on cards disappeared.
With shots on target it was a slightly different story. With fans supporting, home teams had 25% more shots on target than away teams. Without fans, they still had 13% more.

So the crowd doesn’t appear to be the only reason teams play better at home: familiar pitches and no travel are still possibly having an influence. But on the referee’s close calls, the crowd seems to have been doing almost all the work.
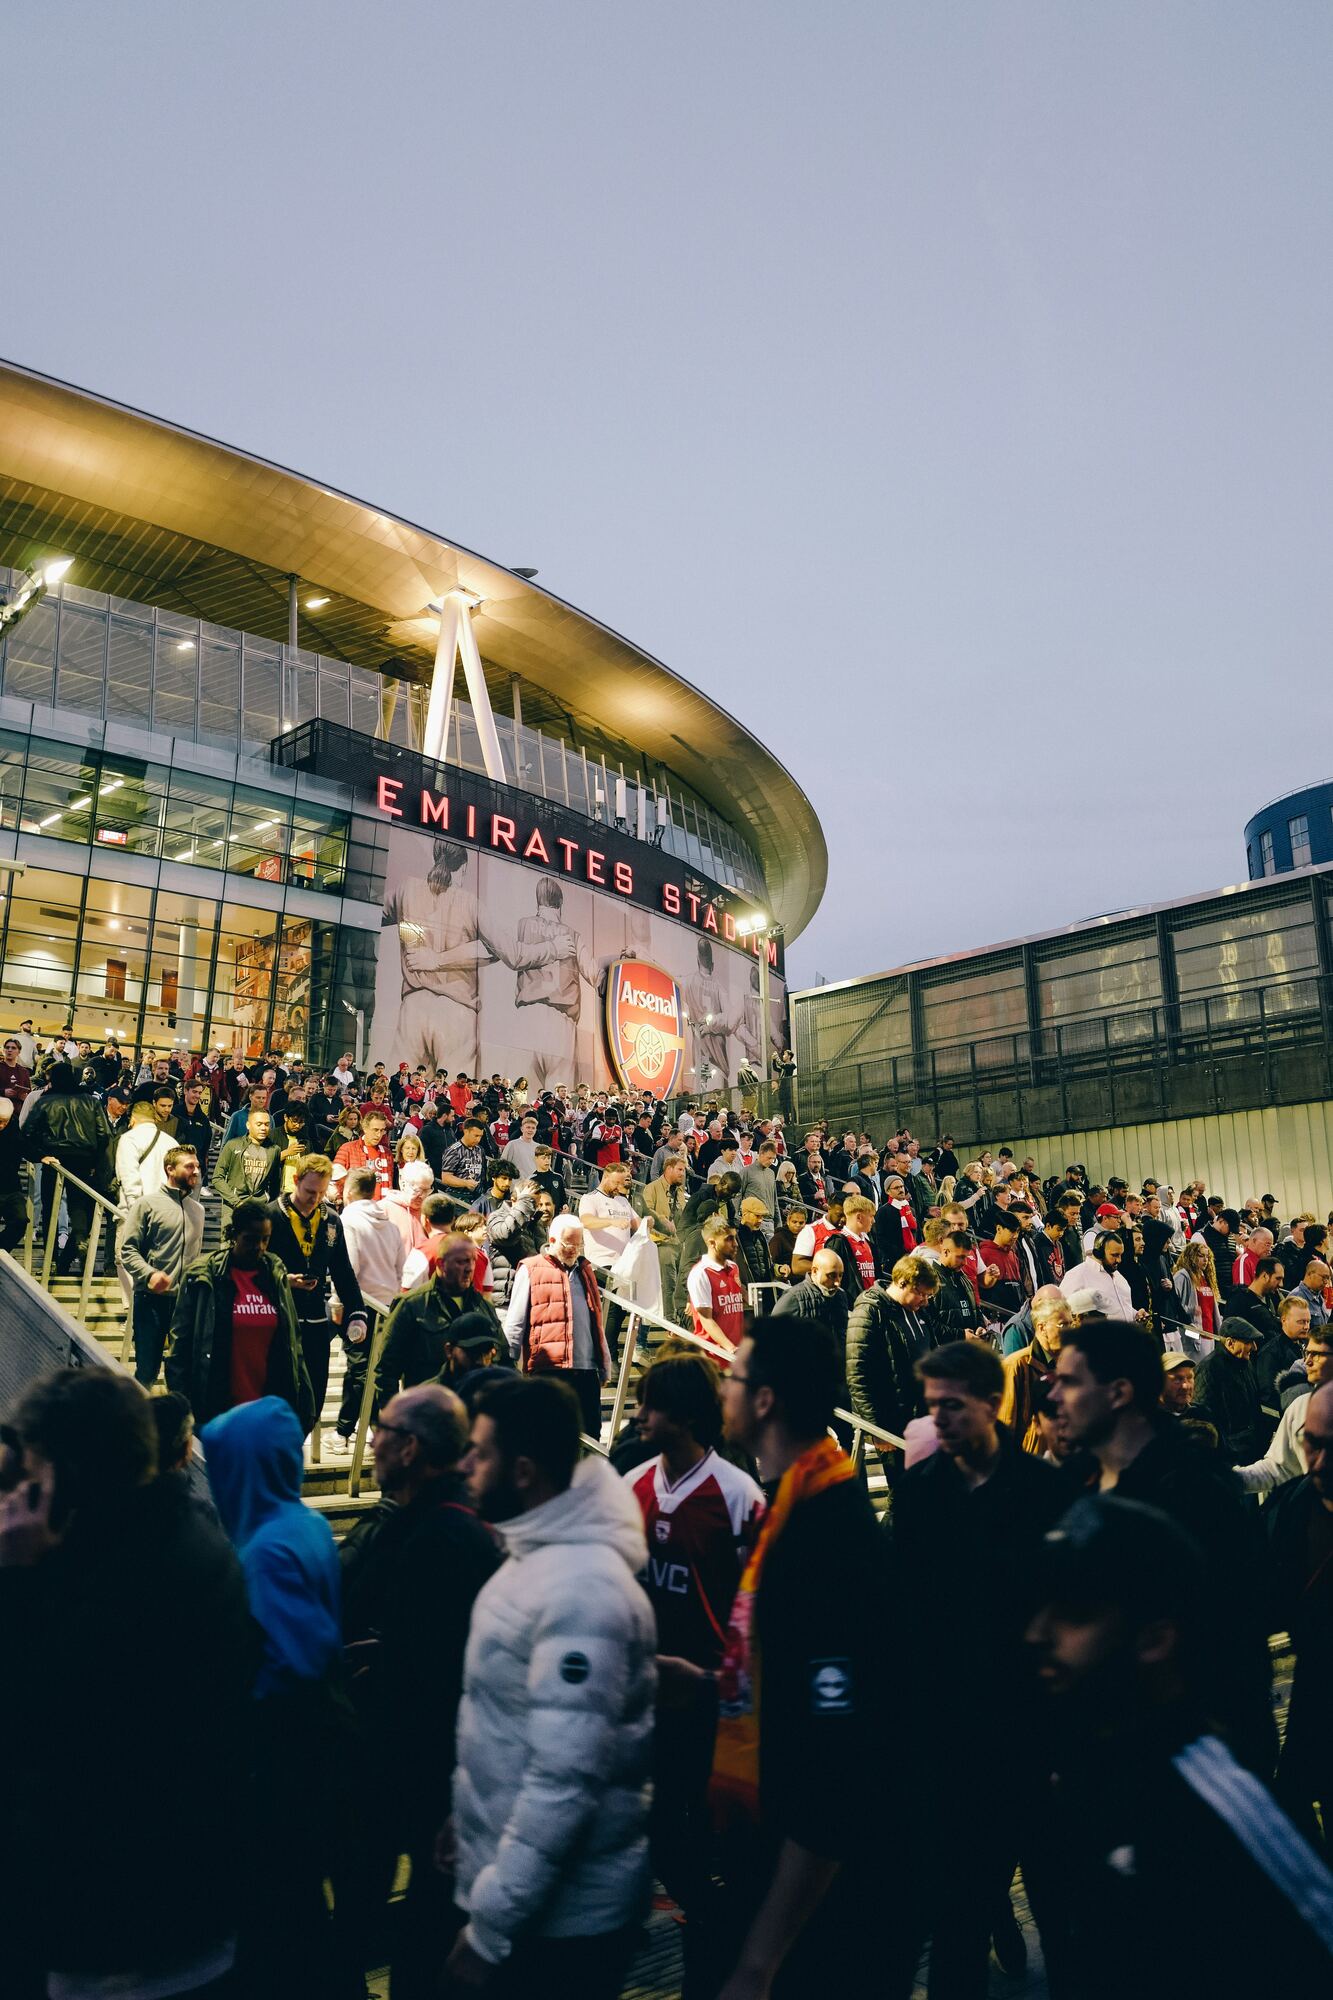
Fans at the Emirates Stadium, London. Photo: James Kirkup on Unsplash
The noise comes back
By the start of 2021-22, the fans were back. So was the gap. Away teams got 2.21 yellows a game again and home teams 1.94, almost exactly where it had been before Covid.
That return matters. Video referees (VAR) arrived in all five leagues before the pandemic and stayed after it, so VAR can’t explain a gap that vanished and then came straight back. The one thing that came and went was the crowd.
None of this means referees are cheats. Asch’s participants weren’t liars either. Most of them were honest people who couldn’t quite trust their own eyes with everyone around them saying something else. And the gap is an average: it is about a quarter of a card a game, not a card in every match.
But for 14 months, Europe’s referees made their close calls in silence. And for 14 months, the home side lost its twelfth man in more ways than one.
For your exam
This story touches social influence: conformity, the variables that affect it, and normative and informational social influence.
Aim
Asch (1951) asked whether people would give an answer they could see was wrong, just because everyone else in the room gave it.
Method
50 male American students each sat with seven confederates and judged which of three lines matched a standard line. On 12 of 18 trials, the confederates all gave the same wrong answer first.
Findings
About a third of answers on those trials went along with the wrong majority. About three in four participants conformed at least once, and about one in four never did.
Variables
Asch varied group size, unanimity and task difficulty. Conformity rose when the lines were harder to tell apart, and fell sharply when one other person gave the right answer.
Explanations
Normative social influence: going along to fit in. Informational social influence: going along because the group might know better. Both were named by Deutsch and Gerard (1955).
Evaluation points
- Strength: a controlled lab task with a clear right answer, so conformity can be measured.
- Weakness: judging lines is trivial, and 1950s American students may not represent other people or times.
- The ghost games data adds real decisions with real stakes, but it is a natural experiment: fans weren’t removed at random, so other changes in 2020 can’t be ruled out completely.
Exam-style question · 4 marks
With fans in the stadium, away teams were shown about 15% more yellow cards than home teams. With no fans, the difference was about 1%. Use your knowledge of task difficulty in conformity research to explain this result.
References
- Asch, S. E. (1951). Effects of group pressure upon the modification and distortion of judgments. In H. Guetzkow (Ed.), Groups, leadership and men; research in human relations (pp. 177–190).
- Asch, S. E. (1955). Opinions and social pressure. Scientific American, 193(5), 31–35.
- Deutsch, M., & Gerard, H. B. (1955). A study of normative and informational social influences upon individual judgment. The Journal of Abnormal and Social Psychology, 51(3), 629–636.
- Nevill, A. M., Balmer, N. J., & Williams, A. M. (2002). The influence of crowd noise on football referees’ decisions. Psychology of Sport and Exercise, 3(4), 261–272.
Sources
- Dortmund 4-0 Schalke, Sports Illustrated
- The Yellow Wall, Bundesliga
- Nevill, Balmer and Williams (2002), Psychology of Sport and Exercise
- VAR in Europe’s leagues, ESPN
- Match data: football-data.co.uk via github.com/datasets/football-datasets (PDDL)
Photos
- Signal Iduna Park: Chris Hahn on Unsplash
- Crowd in Curitiba: Emerson Vieira on Unsplash
- Empty seats: Reed Mok on Unsplash
- Referee: Salah Regouane on Unsplash
- Emirates Stadium: James Kirkup on Unsplash
- Charts made for The Replay Lab